
.png)
You’ve done the work. You’ve optimized your images, implemented code-splitting, and finally achieved a perfect 100/100 performance score on Lighthouse. You deploy with confidence, expecting a ranking boost and a flood of conversions.
Instead, you open Google Search Console a week later to see a sea of red "Poor" URLs under Core Web Vitals.
Why the discrepancy?
The answer lies in Hardware Blindness. You are building on a $3,000 M3 MacBook, but you are selling to a user on a $200 Android or a 4-year-old iPhone. While your lab scores are green, your real-world revenue is leaking through a gap we call the Performance Tax.
To secure your 2026 SEO rankings and stop "Revenue Evaporation," you must look past synthetic benchmarks and embrace the Silicon Truth.
To understand why your metrics aren't matching up, you need more than just "Field Data." You need a hardware-aware audit. This is where the Silicon Matrix Report comes in.
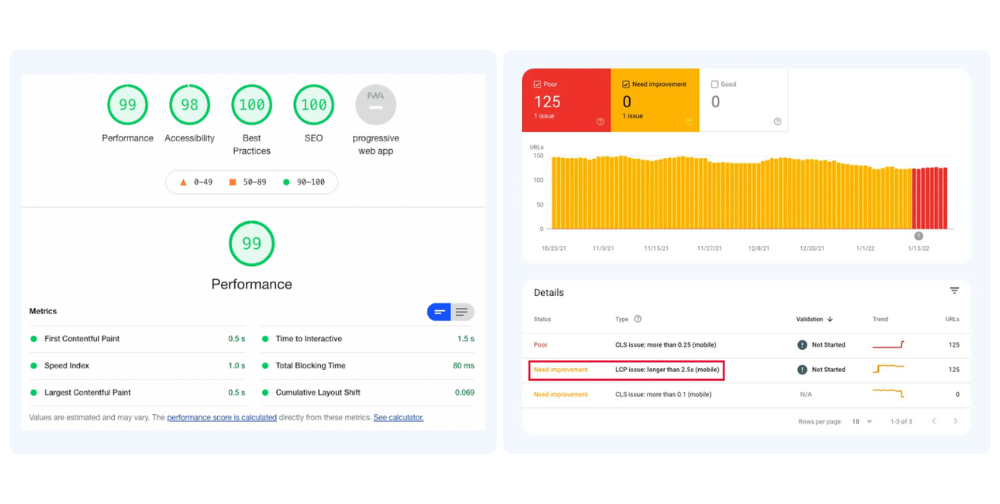
The Performance Paradox. A perfect 99 Lighthouse score (left) often hides the reality of failing Core Web Vitals (right) experienced by real users on varying mobile devices.
This is what tools like Lighthouse or WebPageTest provide. It is a controlled environment with pre-defined device settings and network throttling.
This is data collected from actual users browsing your site in the wild. This data populates the Chrome User Experience Report (CrUX).
The Critical Fact: Field Data is the only metric Google uses for search ranking.
Google’s Core Web Vitals (CWV) initiative is built entirely on the concept that context is king, and the data proves that performance is directly tied to revenue.
A study by Deloitte and Google, titled "Milliseconds Make Millions," analyzed mobile site data across retail, travel, and luxury brands. The findings were staggering:
The Reality of 2026:If you are running a "Luxury" or "Enterprise" campaign, you are paying a premium for those clicks. But if those users land on a page that freezes their main thread, you are experiencing a Luxury Leak. Your ad-spend is hitting "Incompatible Silicon"—users whose devices physically cannot handle your technical weight.
The Fact: If you optimize for Lighthouse, you’re optimizing for a robot. If you optimize for the Silicon Matrix, you’re optimizing for revenue.
If your Lighthouse score is 100 but your RUM data is poor, the culprit is almost certainly device variability and main-thread saturation.
There are thousands of device and network combinations in the wild. While your developer might be testing on a MacBook Pro with an M3 chip and Fiber internet, your users are likely on mid-range Android devices on spotty 4G connections.
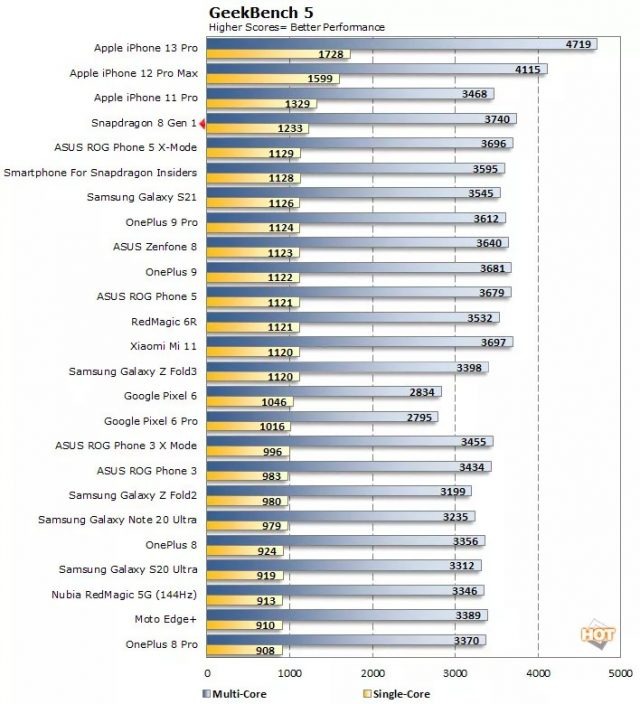
Mobile Processor Performance Gap Chart.(GeekBench5)
The performance gap is massive. A high-end device can execute JavaScript 10x faster than a budget device.
The new Interaction to Next Paint (INP) metric is particularly brutal for React apps. If the main thread is blocked by hydration or heavy computation, a user's click results in a frozen screen.
A single static build of a React app cannot possibly account for this. It serves the same heavy bundle to a flagship workstation and a budget mobile device alike. This is why your Field Data is red—you haven't solved the performance problem; you've only solved it for the developer’s MacBook.
Traditionally, fixing poor scores meant stripping away features to save milliseconds. We are changing that. We move from "Adaptive Execution" to Main-Thread Liberation.
The ReactBooster Engine doesn't just "load" an app; it orchestrates a custom execution path based on the specific CPU, GPU, and NPU signatures of the visitor, calibrated in real-time by SpeedPower.run.
Traditional RUM data often shows a "Long Tail" of frustrated users on mid-to-low tier devices. ReactBooster flattens that curve, ensuring your 95th percentile (P95) performance matches your best-case scenarios.
A perfect Lighthouse score is a vanity metric if your real users are "evaporating" from your funnel.
If you want to dominate search rankings and eliminate the Performance Tax, you must look beyond the lab. You need a strategy that identifies your Hardware Blindness and fixes it with an engine built for the real world.
Ready to see the Silicon Truth? Start your 15-Day Silicon Matrix Audit and discover exactly how much revenue is leaking from your hardware funnel.
Uncover the untapped hardware headroom on your users' devices. Our Silicon Matrix Report identifies exactly where your architecture redlines and calculates the projected ARR you can reclaim by eliminating main-thread jank.
Powered by ScaleDynamics
© 2026 ScaleDynamics. All rights reserved.
Contact Us: contact@scaledynamics.com
Privacy Policy | Legal Information
.png)
.png)
.png)