
Unlock the "Silicon Truth" of your audience.
The Silicon Matrix is a 15-day strategic audit that reveals the true hardware capabilities of your users. By spending 5 minutes to add a 2KB, privacy-first script to your application, we generate a comprehensive intelligence report that bridges the gap between Users' Hardware Devices and Business Profit.
.png)
.png)
.png)
The Silicon Matrix identifies the gap between who you think your customers are and what their hardware says about them on Marketing, Revenue and Product aspects. With these high value data you can adjust your business roadmap.
Are you paying for the audience you think you are?
By mapping your utm_campaign or campaign query parameters to device performance, we verify your ad targeting accuracy.
Verify if your "Luxury" or "Enterprise" campaigns are actually reaching users with flagship hardware.
Identify campaigns attracting entry-level hardware that lead to high bounce rates and wasted ad-spend.
Compare the quality of traffic coming from Google vs. Meta vs. LinkedIn based on the actual power in their users' hands.
We map your financial KPIs directly to device-level execution power to reveal the true cost of "Hardware Blindness."
Discover exactly where in your checkout flow entry-level devices "evaporate" due to processing friction.
By quantifying the "Performance Tax," we demonstrate how delays in UI responsiveness lead to a measurable decline in user conversion.
Measure "Return Rates" and session depth across device tiers to identify where hardware friction is killing your LTV.
Is your digital experience scaling, or stalling across borders?
We audit the global hardware distribution of your user base to align your product’s technical weight with your international growth objectives.
See if your brand is perceived as "Premium" in the US (High-End devices) but "Value" in France (Entry-level devices).
Calculate the % of paid clicks hitting "Incompatible" devices—users who bounce before your page even becomes interactive.
Validate your "Hardware-Market Fit" before committing marketing spend to a region where your current architecture may be too heavy.
We provide engineering data so you can work on your roadmap. Engage AI at edge? Move cloud processing tasks to high-end devices? Define advanced features? with our report, you take decisions based on concrete data.
.png)
Get a detailed estimation of the unused computing power that is available across your entire user base. You can shift heavy tasks directly onto your users' silicon, eliminating server execution costs.
A global census of CPU and GPU capabilities segmented by path and country. Pinpoint "Power User" concentrations and identify exactly where flagship silicon is sitting idle.
A specialized feasibility study for AI deployment. We analyze Javascript, WebGPU and WASM AI performance to indicate which kind of AI models your users can actually run locally today.
Know exactly what percentage of your users base can support WebGPU or WASM before you spend months on a technical architecture that might only works for a fraction of your audience.
Stop building for an "average" user that doesn't exist. Build for the reality of your traffic.
A census of every CPU core and GPU feature available across your user base. Segmented by Path and Country, so you know exactly where your "Power Users" are concentrated and what compute resources are currently being wasted.
A specialized feasibility study for AI deployment. We analyze Javascript, WebGPU and WASM AI performance to indicate which kind of AI models your users can actually run locally today.
Know exactly what % of your users can support WebGPU or WASM before you spend months on a technical architecture that only works for a fraction of your audience.
The Silicon Matrix identifies the goldmine; ReactBooster is the tool to extract it.
Once the report identifies your hardware opportunities, the ReactBooster Engine allows you to execute:
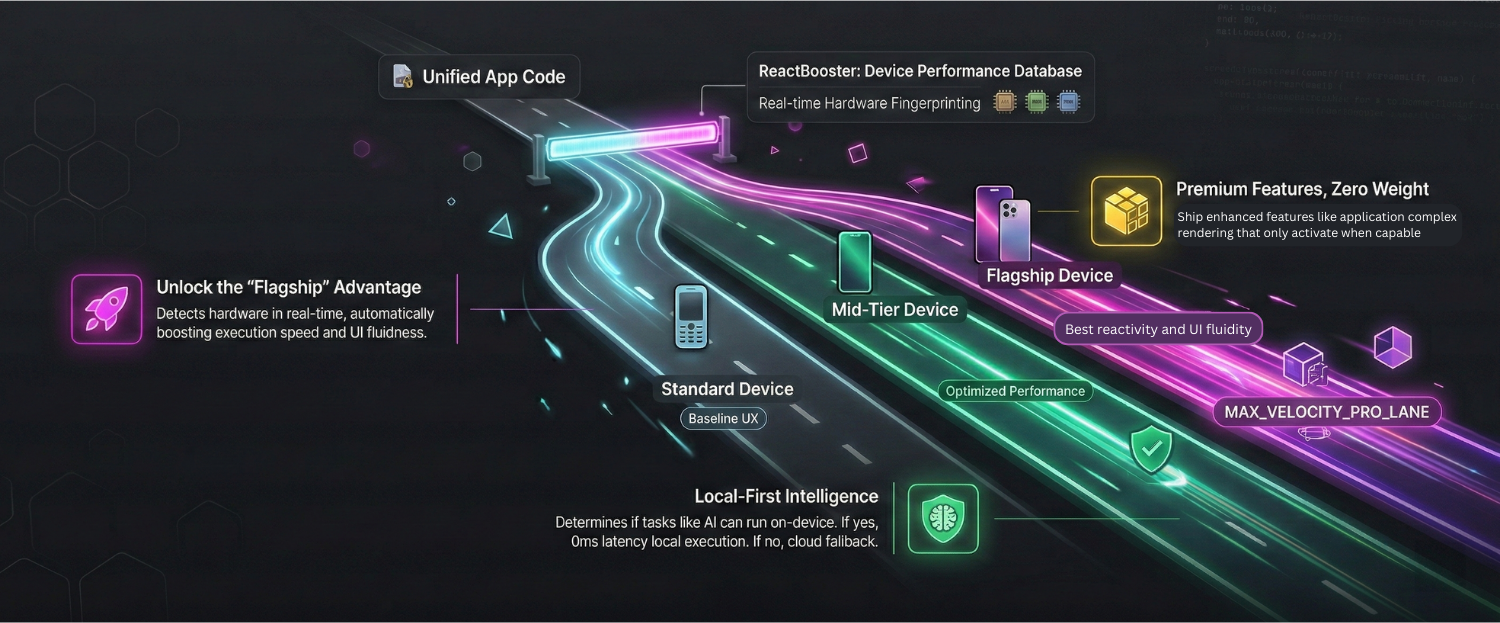
Move 100% of non-UI logic to background threads. This doesn't just help entry-level devices, it unlocks the full multi-core usage of CPUs for mid/high-end devices.
By offloading heavy processing, you push the interface to a Zero-Latency UI, ensuring your UX is buttery smooth regardless of background workload.
Migrate expensive cloud processing (AI, data parsing, encryption) to the user's device, reducing server OpEx by up to 47%.
Serve a "Lite" experience to save the sale for entry-level users, while unlocking "Flagship" features for your premium audience.
We utilize the SpeedPower.run engine to execute real-world saturation benchmarks directly on the user's hardware. This data - representative of a modern, heavy web application - calculates the Silicon User Device Capability Score at the heart of the Silicon Matrix.
Instead of guessing based on static model names or theoretical hardware specs, we measure the 'True Usability' of the silicon. By stress-testing the device’s ability to handle concurrent processing, Edge-AI tasks, and main-thread saturation, we identify exactly how much 'Real-World Room' your application actually has. We don't just see the device, we see its pulse.
These projections are not based on generic industry benchmarks. Every metric is precision-modeled using the specific hardware telemetry and task-saturation data captured during your unique Silicon Matrix Audit, ensuring a ROI forecast tailored to your user base.
By offloading computationally intensive tasks from expensive cloud instances (AWS/GCP) directly to the user's local silicon, we drastically reduce server-side execution costs and API overhead.
High-fidelity, adaptive performance eliminates the "micro-churn" caused by UI stutters. Smoother workflows lead to higher user engagement, longer session times, and increased Lifetime Value (LTV).
Stop paying for traffic that bounces due to hardware incompatibility. By optimizing for the global device spectrum, your app remains performant on mid-tier hardware, maximizing your CAC-to-LTV ratio.
Through multi-core orchestration, we move all heavy logic and VDOM diffing to background workers. This guarantees a native-grade, 60FPS experience where user input is never forced to wait on code execution.
The Silicon Matrix is built for performance, not surveillance. We provide deep hardware insights without compromising user privacy. Our script is 100% compliant with GDPR, CCPA, and PECR.
We do not collect names, emails, IP addresses, or unique user IDs. We see the device, not the person.
We don't drop tracking cookies to follow users across the web.
All insights are presented in aggregate cohorts. We measure "How many Mid-Range devices," not "Who is using this device."
We focus on performance metrics rather than unique browser configurations, keeping your users anonymous.
At only 2KB, our script has no impact on your site's privacy budget or performance score.
Uncover the untapped hardware headroom on your users' devices. Our Silicon Matrix Report identifies exactly where your architecture redlines and calculates the projected ARR you can reclaim by eliminating main-thread jank.
Powered by ScaleDynamics
© 2026 ScaleDynamics. All rights reserved.
Contact Us: contact@scaledynamics.com
Privacy Policy | Legal Information